Measure Performance Against Benchmarks

How well are you doing compared to your peers?
Comparing results between lenders with similar groups of customers can provide real insight into where each lender is performing better or worse than its peers. These insights start with the application process and measuring the mix of potential customers to see differences in approval rates and who your customers are.
Discovering performance differences can also identify the success of marketing programs (customer usage and retention) and collections effectiveness. Successes should be exploited; deficiencies should be addressed. As a result, you can significantly improve business results in each segment of each portfolio.

Comparative Benchmarking of Key Metrics

DETAILED DATA

Your customer performance data is combined with product, demographic and credit characteristics to build detailed profiles to drill down into your business results.

RELEVANT COMPARISONS

Your detailed groups are matched to similar accounts at your competitors so that you have apples-to-apples comparisons detailing both portfolio mix and performance differences.

DATA + VISUALIZATIONS

Seeing is believing. We present the data both graphically and in tables to make it easy to identify and understand differences and where you can improve.
The examples below give just a hint of the types of information you'll have access to when you dig into benchmarking data.

Some Examples

Seeing is believing. How easy is it to leverage insights into performance differences?
The benchmarks will compare segment performance along all key factors. We also will show analysis of originations and approval rates to help identify opportunities in booking new accounts.
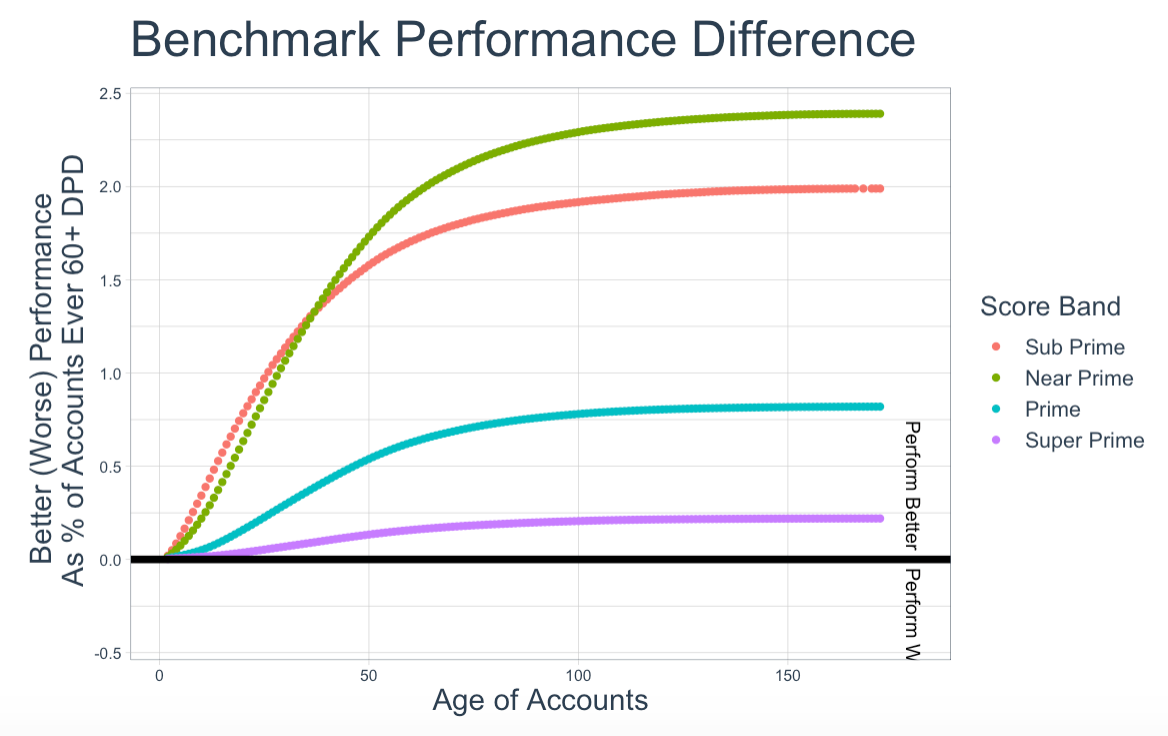
The performance benchmark looks at how well accounts perform based on their vintage or account age. Here you can see that the portfolio is performing better for all score segments but particularly for the lower scoring sub-prime and near-prime groups.
The value comes in figuring out how to leverage this information. Should you pursue or avoid some segments? What do you need to do to preserve historical advantages? Are market changes likely to impact future performance and how?
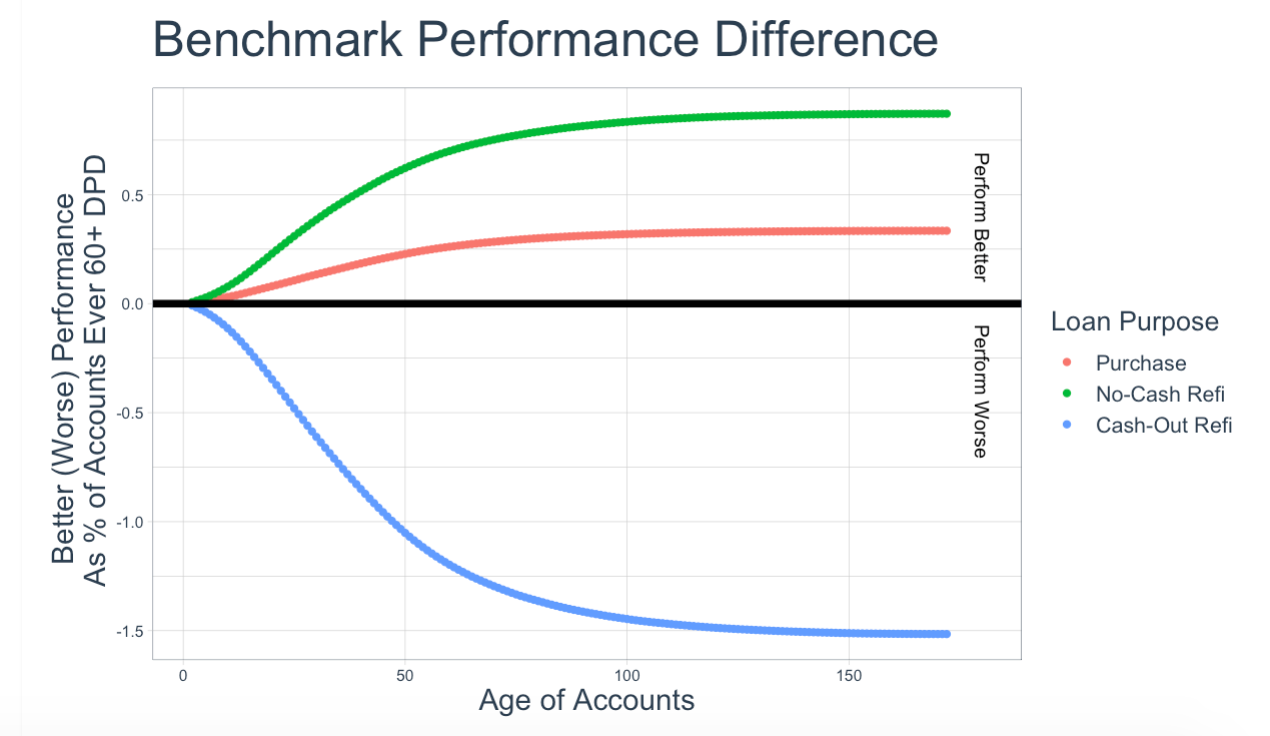
In this example the benchmark highlights the performance difference based on loan purpose. Here the portfolio is performing better for purchase and no-cash refinance mortgage loans. But cash-out refinance loans are performing significantly worse.
This should raise a range of questions. First, do your marketing materials stress cash-out refinancing perhaps linked to high loan-to-value underwriting policies? Is this leading to adverse selection? Second, are certain channels responsible for much of this difference?
The drill down tool supports quick and easy analysis to answer most questions so you can act to improve future results.
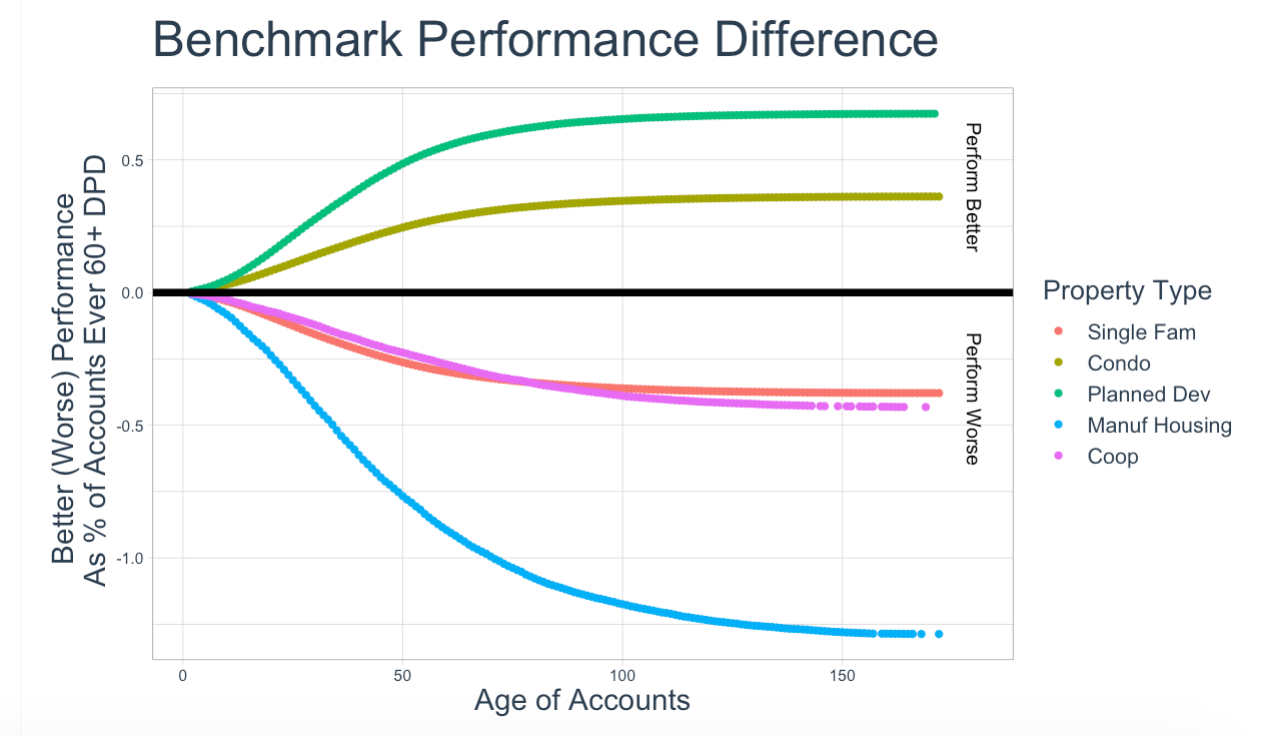
Here we're looking at performance by property type securing the mortgage loan. Here planned community and condo loans are performing well. However, other property types, particularly manufactured housing loans, are doing worse.
It's possible that some segments are small and a few loans are distorting comparisons. You can easily see this in looking back at your new account analysis. Seeing differences early in the account lifecycle allows you to take action sooner.
This is another example of how the drill down tool can help identify the source of the problem. Is it only some segments (e.g., high LTV loans) causing the difference? Or is the challenge broader?

Portfolio Mix

Differences in the mix of accounts in your portfolio can reflect strategic choices or market realities. Monitoring changes over time can show whether planned shifts are realized. Also, comparing approval rates can identify areas of missed opportunities.
Key Metrics: 
Distribution of applications and approved accounts by:
  -- Risk level
  -- Balance level
  -- Channel source
  -- Product type
Approval rates by segment

Mix of Accounts

Storm Clouds of Risk

Risk Management

Compare the behavior of your accounts to an 'apples-to-apples' group by major dimensions such as credit score, product, and channel
Key Metrics by key segments: 
Unit and dollar delinquency and loss rates 
Average outstanding balance
Vintage analysis
Marketing Effectiveness

Measuring profit per account by segment can highlight pricing differences (both revenue and funding rates) and whether your pricing reflects risk levels adequately.
Key Metrics by segment: 
Products per Customer
Average outstanding loan balance
Risk adjusted exposure

Cross-Sell Success

Collections Effectiveness

Roll Rate By Risk Level

Your ability to collect on delinquent accounts is an important metric. Higher risk accounts naturally will likely fall more delinquent. Comparing your success to others can highlight strategy, tactic or training issues.
Key Metric:s 
% of accounts falling further delinquent by stage of delinquency
Full payment share

Account Profitability

If you add account profitability to your services you can compare profit per account by segment to like groups of accounts. This can highlight pricing differences (both revenue and funding rates) and whether your pricing reflects risk levels adequately. Your return on your marketing investment may reflect the success of cross-sell penetration programs as well as customer persistency.
Key Metrics by key segments: 
Gross yield
Cost of funds rate
Risk adjusted net interest margin
ROA

Making Money

Ready for Action?

Meet all your CECL and regulatory compliance requirements and start down the road to gain insights into your business, improve strategies and tactics, and boost overall profits by contacting us now.
215.740.7028
info@CECLNow.com
LET'S GO!
userschart-barsmagnifierchevron-up-circle
>