[04-Jan-2025 09:07:06 UTC] PHP Fatal error: Uncaught Error: Undefined constant "ABSPATH" in /home/cdgcgpbh/ceclnow.com/wp-content/plugins/thrive-visual-editor/thrive-dashboard/inc/app-notification/classes/DbMigration.php:2 Stack trace: #0 {main} thrown in /home/cdgcgpbh/ceclnow.com/wp-content/plugins/thrive-visual-editor/thrive-dashboard/inc/app-notification/classes/DbMigration.php on line 2 Credit Unions Bounce Back. Which Ones Are Lagging Behind? | CECL Now

Credit Unions Bounce Back.
Which Ones Are Lagging Behind?

March 14, 2021

Credit Unions' Returns Back to Pre-Pandemic Levels

Differences by asset size persist

Credit Union Times presents some interesting information. Unfortunately the headline, "Small Credit Unions Not Sharing in Recovery", seems not quite right. But it depends on your perspective.
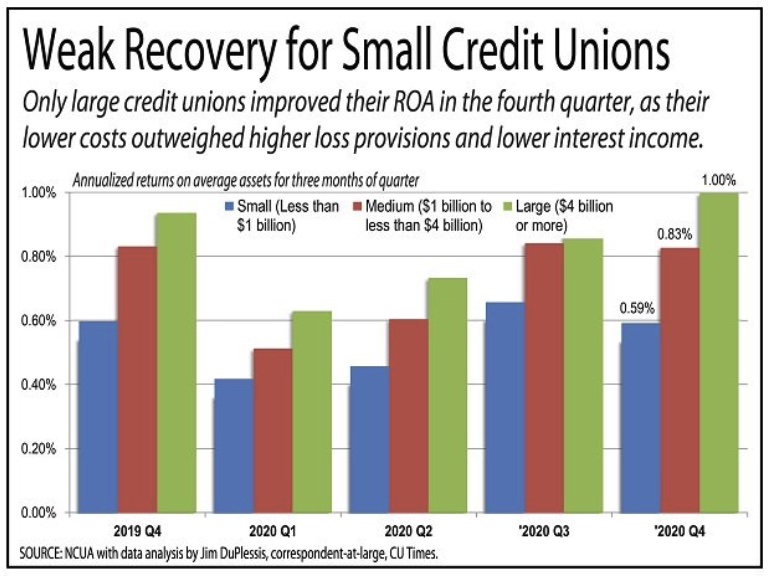
Overall credit union returns in Q4 2020 were at or above rates from a year earlier. The largest (over $4 billion in assets) had the best returns and the biggest change year-over-year. Return on assets was about 1.0% in Q4, up significantly from 0.62% in Q2 2020.
Smaller credit unions -- those with less than $1 billion in assets -- had returns of 0.59% in Q4. Hence the headline. The difference was attributed to "small credit unions' high overhead burden" which, quite logically, has always been the case. Smaller credit unions' returns were up from about 0.43% in Q2 but down from Q3's 0.63%.
That drop from Q3 should be more alarming. Assets for all credit union groups are up significantly over the past year. Combined with the sharp drop in interest rates this put pressure on net interest income.
Credit Union Quarterly Profits
Income-Expense Breakdown
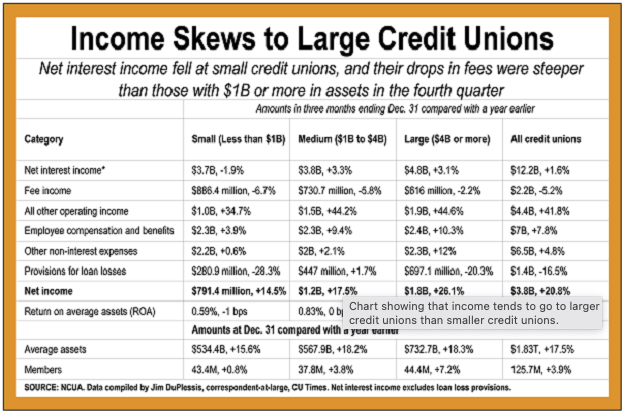
The breakdown of the income statement highlights key drivers by asset size. Interest income for smaller credit unions was down despite a 15.6% increase in average assets. This contrasts with increases of over 3% for larger credit unions.
Where the article seems to be wrong is that employee compensation and other non-interest expenses were both up much more for the larger credit unions. This seems to counter the argument that overhead costs were holding smaller credit unions back. As the table here shows ROA was down 1 basis point for the smaller credit unions, flat for medium-sized credit unions, and up 6 basis points for the largest. Returns for the smallest credit unions were aided by a 28% decrease in the provision for loan losses.
It seems likely that the mortgage refinance boom aided the larger credit unions more than the smallest. Mortgage origination is definitely a business that benefits from scale. As interest rates increase that difference is likely to dissipate. And as fiscal stimulus wears off (at some point in the future) growth in average assets will likely return to historic levels.
What's also likely to change is the drop in loan loss provisions. The increase in average assets likely led to more loans at most institutions. As these loans mature that's likely to lead to higher provisions in 2021. Not to mention the effect that CECL will have once implemented by credit unions of all sizes by the end of 2022.
The difference in performance between credit unions will always be hampered by overhead. But within the same size bands asset mix and credit quality are likely going to be the primary drivers in performance. As all institutions implement CECL these factors will only become more significant. Credit unions that use CECL as a way to deepen their insights into their portfolios to improve marketing/sales, underwriting and account management will be leaders. Benchmarking will be a crucial element to success here.

Ready for Action?

Meet all your CECL and regulatory compliance requirements and start down the road to gain insights into your business, improve strategies and tactics, and boost overall profits by contacting us now.
215.740.7028
info@CECLNow.com
LET'S GO!
chevron-up-circle
>