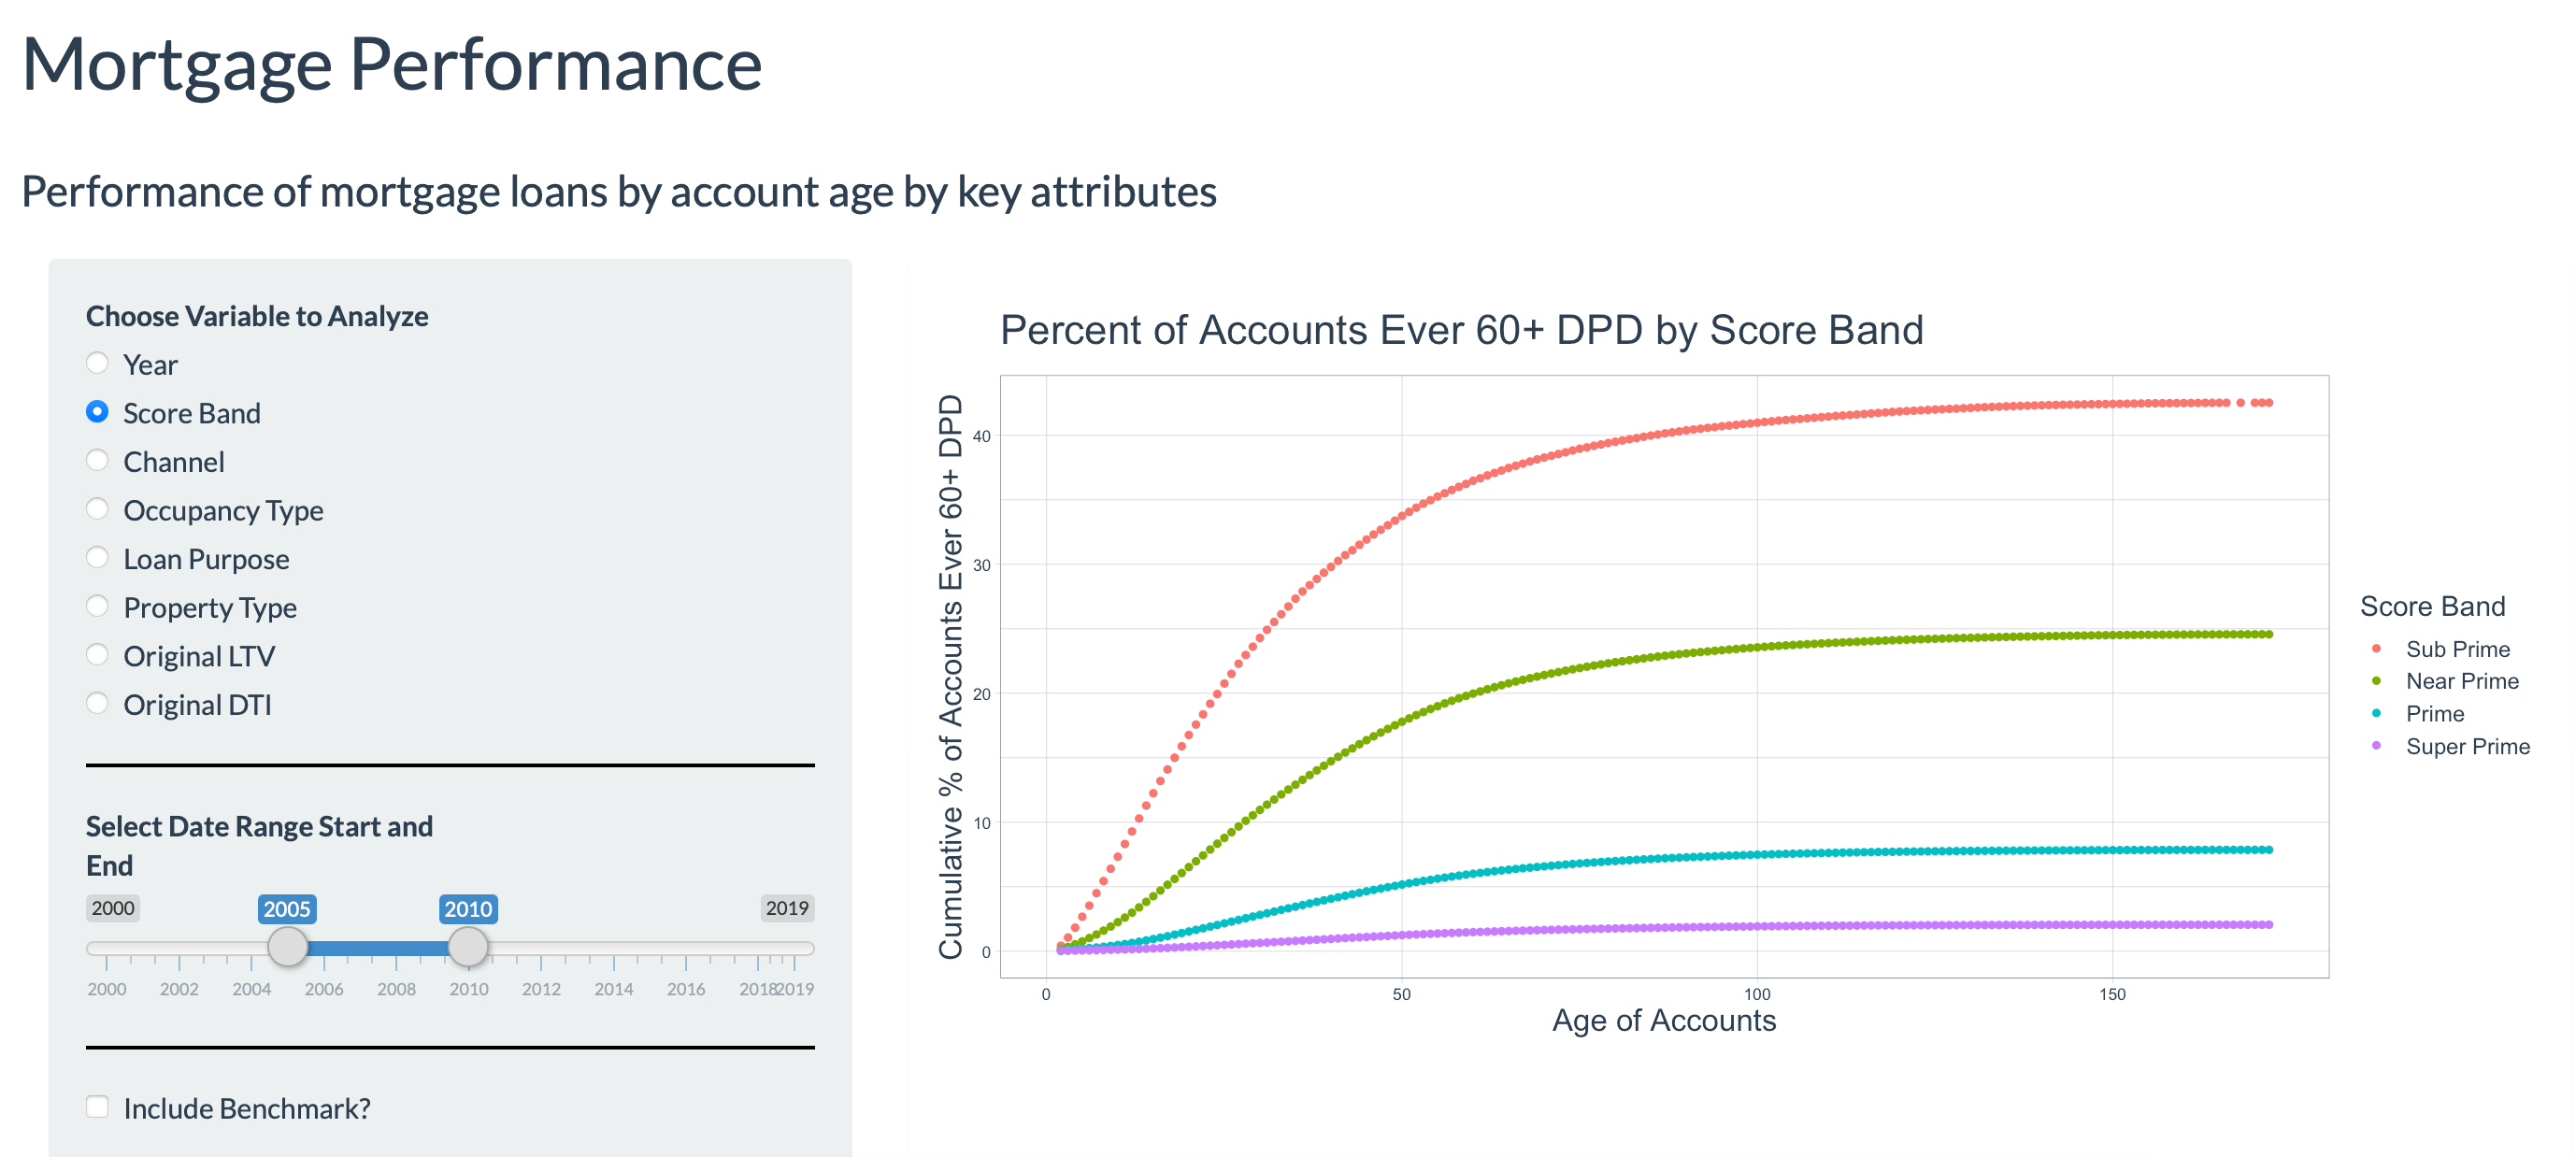
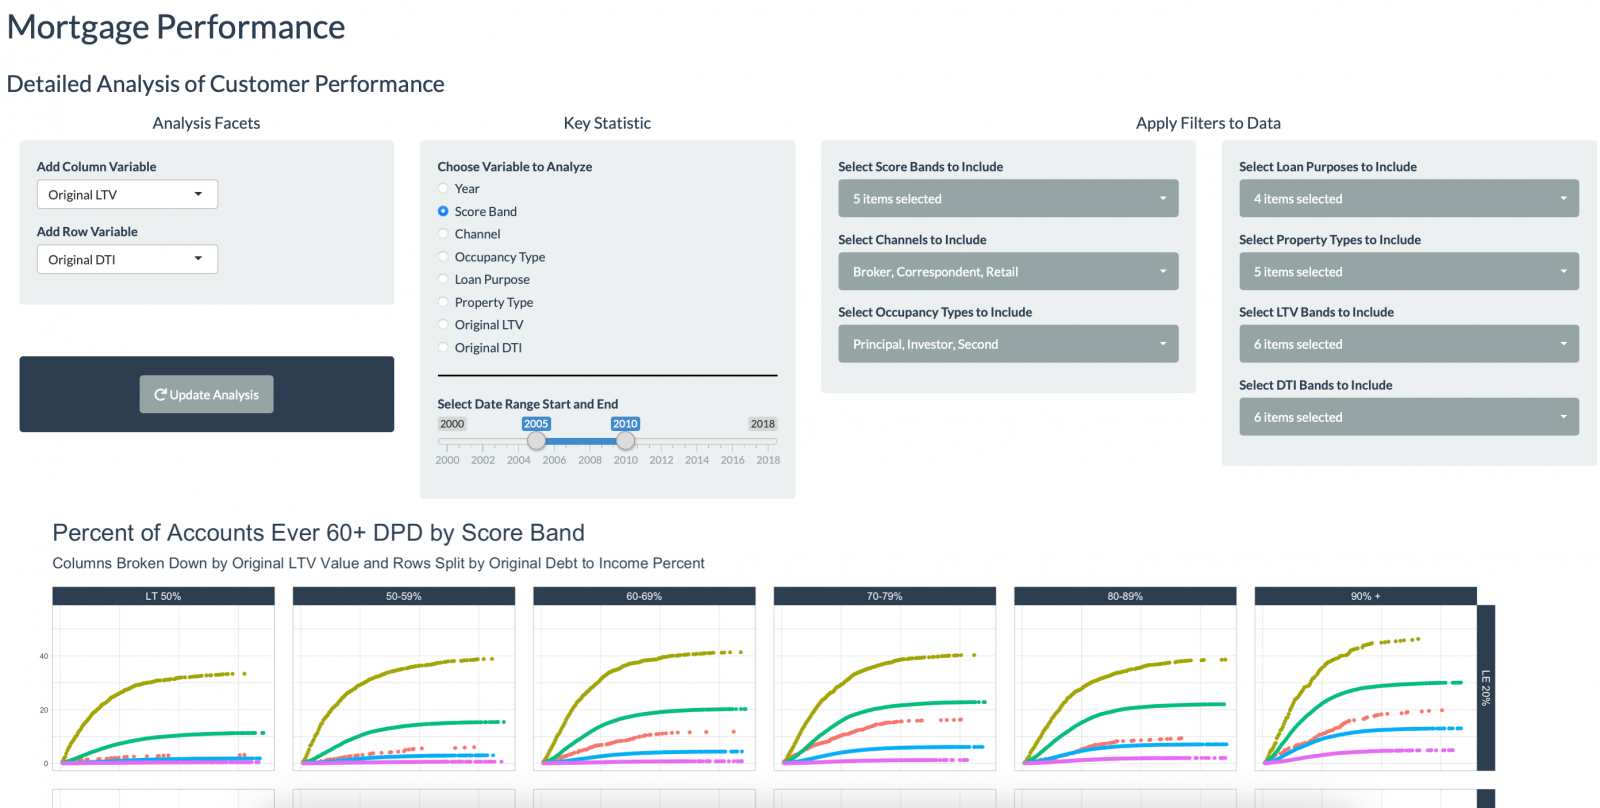
CECL is a data driven accounting and disclosure challenge for lenders not used to analyzing their customer data. The hurdles they see when faced with capturing, structuring, storing and analyzing their data can seem insurmountable. But once those challenges have been met -- data is captured and loaded into a time-series database specifically designed to support analysis -- users can begin to analyze their customer data and performance to improve future results.
So What Analytic Tools Should We Be Using?
The only tools you should have are the ones you'll use. What does that mean in practice?
There are many toolkits out there. SAS is a well known tool but is expensive and requires lots of training to use. Other tools such as R and Python are inexpensive but still require training and experience to use effectively. All of these tools are very powerful and support very powerful analytic approaches including modeling.
A better solution for lenders beginning to use analytics is to have a easy-to-use, graphical tool that displays their data in ways that deliver insights and support decisions and actions.
CECLNow handles all of the initial hurdles to load your data in a structured way specifically designed to support CECL and other analytic needs. But one of our key benefits is that we make data accessible that gives you the ability to assess customer performance along key dimensions such as risk level and collateral values. The visual presentation of this data makes it easy to see performance differences and identify segments that fall outside your risk tolerance.
What Key Features Should the Tools Have?
Here are things you should look for in choosing your CECL solution and its analytic support tools:
Ease of use speeds adoption and application. The more time taken to learn how to use a tool the less time analysts spend analyzing your data. Users should be able to filter data, change analysis dimensions, and change the key metrics used.
How clearly does the tool present the data? While charts have their place, graphs typically make it much easier to understand the analysis, especially in comparing results between groups. Time spent struggling to understand the data is less time spent analyzing data.
Many questions can be answered based on high level, pre-defined splits. However, as you drill down into the data to get more specific you'll need to add multiple criteria and different metrics to the analysis. You also will want to filter out some accounts. For example, you might want to exclude discontinued products from performance analyses even though they will continue to be included in the CECL reserve calculation.
Any time data and results are presented it's important that there's a shared understanding of what it all means. Definitions of data and sources is important. Ideally this would include expected distributions of data. Definition of the metrics used are critical to making data-based decisions. For example, does everyone have a shared understanding of vintage analysis?
Easy to Communicate Findings
Sharing data with the people who need to know -- the decision-makers. The points above apply to the users of the reports. They should be easy to obtain (distribute), easy to understand, and come with appropriate documentation to ensure a common basis for decisions. The tools should allow users to download and distribute reports easily.

